Faculty/Researcher Survey on Data Curation
Greg Janée <>
UCSB Library; Earth Research Institute; California Digital Library
James Frew <>
Bren School of Environmental
Science & Management
doi:10.5062/F4PN93K4
Contents
- Executive summary
- Survey design
- Implementation
- Plots and analysis
- Survey comments
- Appendix: survey meta-analysis
- References
- Notes
Executive summary
In 2012 the Data Curation @ UCSB Project surveyed UCSB campus faculty and researchers on the subject of data curation, with the goals of 1) better understanding the scope of the digital curation problem and the curation services that are needed, and 2) characterizing the role that the UCSB Library might play in supporting curation of campus research outputs. The project received responses from one-third of the estimated target audience of 900, indicating great interest in the topic and yielding statistically significant results. To summarize the survey's findings:
- Curation of digital data is a concern for a significant proportion of UCSB faculty and researchers.
- Curation of digital data is a concern for almost every department and unit on campus.
- Researchers almost universally view themselves as personally responsible for the curation of their data.
- Researchers view curation as a collaborative activity and collective responsibility.
- Departments have different curation requirements, and therefore may require different amounts and types of campus support.
- Researchers desire help with all data management activities related to curation, predominantly storage.
- Researchers may be underestimating the need for help using archival storage systems and dealing with attendant metadata issues.
- There are many sources of curation mandates, and researchers are increasingly under mandate to curate their data.
- Researchers under curation mandate are more likely to collaborate with other parties in curating their data, including with their local labs and departments.
- Researchers under curation mandate request more help with all curation-related activities; put another way, curation mandates are an effective means of raising curation awareness.
- The survey reflects the concerns of a broad cross-section of campus.
These findings echo and complement similar surveys performed by other higher education institutions, including surveys at the University of Colorado, Boulder [4], California Polytechnic State University, San Luis Obispo [7], Georgia Tech [8], and University of Oxford [9], as well as the Digital Curator Vocational Education Europe (DigCurV) Project [2].
Taken together, these findings argue for the establishment of a campus unit possessing data curation expertise and providing curation-related assistance to campus researchers, and possibly hosting curation services (as necessary and as funding allows).
Survey design
The survey was intended to capture as broad and complete a view of data production activities and curation concerns on campus as possible, at the expense of gaining more in-depth knowledge. Thus the survey asked only five questions that could be answered in five minutes. Each question was multiple choice/multiple answer, and also allowed an open-ended response to be entered. Four of the questions and answer selections were specifically chosen to characterize the features of a future curation unit, and to discriminate between different potential development paths of that unit. One question was reserved for gathering rudimentary demographic data. Other questions that might have provided interesting data but would have yielded no clear direction for future development ("What file formats do you use?", "How much data do you generate?", etc.) were omitted for the sake of brevity.

The questions were:
-
In the course of your research or teaching, do you produce digital data that merits curation?
The intent of this question was to gauge the size of the data curation problem on campus. There are many ways that size could potentially be measured: by amount of data; by numbers of distinct datasets or data objects; by number of file formats in use; by numbers of research projects or funding grants; and so forth. For this survey we chose to measure size by number of researchers affected (and, indirectly, number of departments affected) because, for many curation services, the major cost of the service is directly correlated with the number of users. Additionally, users represent the interface points for service outreach and use.
This question was yes/no, and a "no" response precluded responses to subsequent questions, including the demographics question. As a result of this survey logic we have no data on the demographics of the researchers for whom data curation does not apply; then again, it is unlikely that respondents would continue to fill out a survey they already considered to be inapplicable.
-
Which parties do you believe have primary responsibility for the curation of your data, if any?
The broad societal questions of who is responsible for data curation, who pays for data curation, and who performs the actual work of curation, are largely unresolved at this time. The intent of this question was to gauge who researchers believe should be responsible. The choice of the word "responsible" here was deliberate, as our intent was to focus, not on who is or is not handling data curation at present, or who should be doing the work of curation, but rather, who is ultimately responsible for ensuring that curation happens.
Though the use of the adjective "primary" in the question wording might seem contradictory with a multiple answer question, many researchers did in fact indicate more than one answer.
-
Are you mandated to provide for (or otherwise participate in) the curation of your data, and if so, by which agencies?
Mandates are a relatively new phenomenon; for example, the National Science Foundation's requirement for data management plans dates only to 2011. But mandates are key and growing motivators, and this question helps us understand to what extent they will play a role in the future.
-
What data management activities could you use help with, if any?
Each of the answers named by the survey leads to a distinct activity on the part of a future curation unit.
-
With which departments, programs, and ORUs are you affiliated?
There are several ways that respondents could be characterized for demographic purposes: by discipline, by data type, by funding source, etc. We decided that departmental affiliation would be the easiest answer for respondents to provide that would yield useful data.
This question was intentionally placed last on the survey. Given that it should be trivial for any researcher to record his or her departmental affiliations, the question doubly serves as a survey completion marker.
Following the above questions was a final opportunity to provide any additional comments (and many respondents did so).
Implementation
The survey was implemented online using SurveyMonkey. It was anonymous to allay any concerns over personal identification and thereby encourage participation. Web browser cookies were employed only to ensure receiving at most one response per survey recipient (technically, one response per web browser).
The survey was a blanket survey: the target population was all UCSB faculty and researchers. Identifying and contacting this population was actually somewhat difficult, as the University keeps no master record of researchers, nor is there a uniform mechanism for contacting them. Campus-wide mailing lists were eschewed as being too broad in scope (such mailing lists would also reach administrative staff, for example) and too duplicative (faculty typically receive the same campus-wide announcements via every departmental affiliation). To minimize duplicate emails, the survey announcement was sent through two distribution channels: the Academic Senate, which maintains a direct mailing list of all tenure-track faculty; and the Office of Research, which maintains a list of all ORUs (organized research units) on campus. In the latter case the Office of Research forwarded the survey announcement to the ORUs with a request to use whatever internal mechanisms they have available for contacting their respective researcher pools. This approach still resulted in some duplicate emails, though we believe the problem was minimized to the extent practicable.
Faculty and researchers were contacted via an initial email message. Three weeks later a reminder email message was sent. Another week after that, subject librarians within the Library performed targeted outreach to their respective departments.
The raw data was manually examined and refined before being subjected to statistical analyses. In some cases answers were changed when the intention was obvious (e.g., a respondent who manually entered "Computer Science" as a departmental affiliation, but failed to check the "Computer Science" box).
Availability of the raw survey data is subject to the approval of the UCSB Human Subjects Committee.
Plots and analysis
A few notes on interpreting the plots below:
The first survey question, which asked if the subject of data curation (and the survey itself) is applicable to the respondent, was yes/no and required. Only if the respondent answered "yes" could he or she continue through the remainder of the survey. As a consequence, for the first question only, percentages are relative to all responses received; for all subsequent questions, percentages are relative to the number of "yes" responses to that first question of applicability.
Because questions were multiple choice and multiple answer, percentages may (and generally do) sum to more than 100%.
In several bar charts below, multiple solid bars are contained within a larger, hollow bar. In such cases the hollow bar represents the union of the responses represented by the solid bars. Both the solid and hollow bars are plotted against the same vertical axis. Again, because respondents were free to select multiple choices, a hollow bar's constituent percentages may sum to more than the hollow bar's overall percentage.
Curation applicability
-
In the course of your research or teaching, do you produce digital data that merits curation? 225 of 292 (77%) of respondents answered "yes" to this first question, which corresponds to 25% of the estimated population of 900 faculty and researchers who received the survey. We can counter the survey's non-response bias, and achieve a better estimate of the percentage of all campus researchers for whom digital curation is applicable, by exploiting the fact that the survey was implemented over three phases: an initial phase followed by a reminder phase and then an outreach phase (see Survey meta-analysis below for details). Under the hypothesis [1, 3, 5] that later respondents for whom digital curation is not applicable are more likely to respond negatively instead of simply ignoring the survey (the decreasing percentages of "yes" responses observed in this survey is consistent with that hypothesis), we conclude that data curation is a concern for up to 60% of all UCSB faculty and researchers.
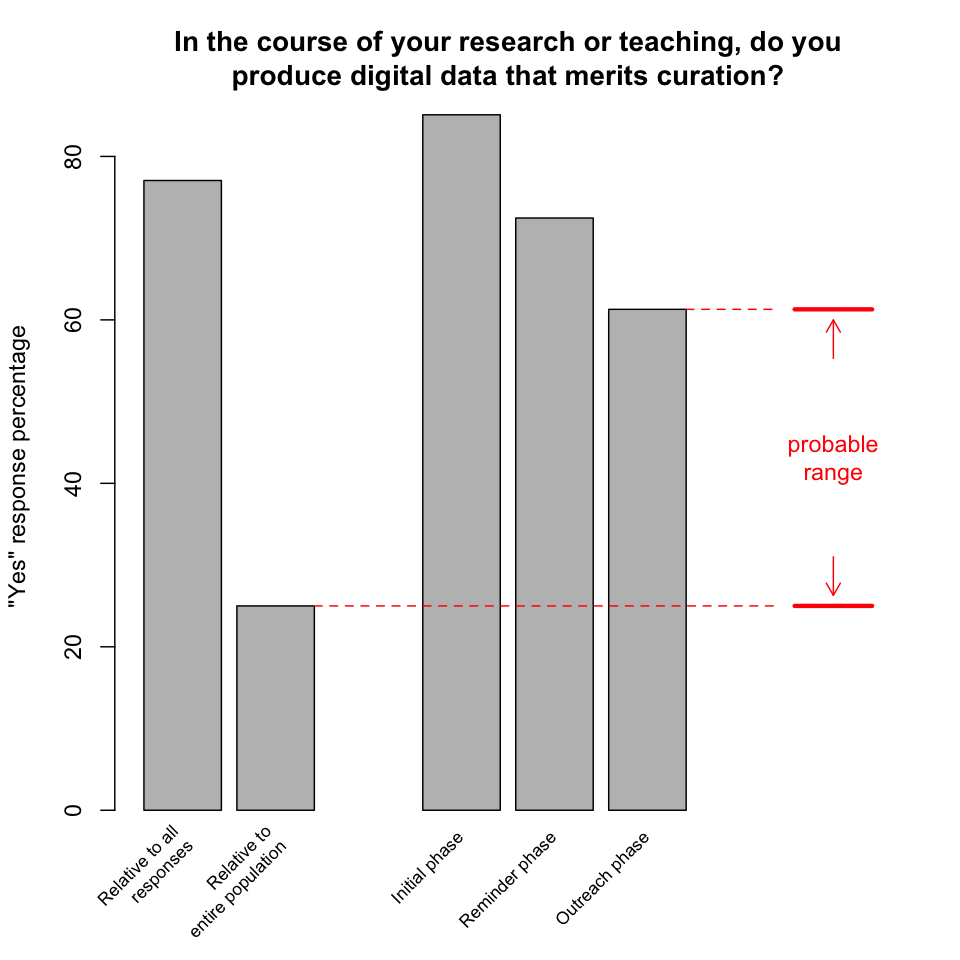
Finding: Curation of digital data is a concern for a significant proportion of UCSB faculty and researchers.
Responsibility
-
Which parties do you believe have primary responsibility for the curation of your data? Almost all respondents identified themselves as being personally responsible. At the same time, every other party mentioned by the survey was selected by a non-trivial fraction of respondents, and respondents' comments mentioned additional parties, notably journal publishers and professional societies.
The large number of parties identified, and the de facto lack of formally recognized roles and divisions of responsibility in many cases, yields a complex landscape. But the overwhelming emphasis on personal responsibility is ultimately reassuring. Awareness of data and commitment to its preservation are two key preconditions for successful data curation. That researchers are willing to assume responsibility indicates that these preconditions are likely to be satisfied. This result also suggests that the point of interaction between a curation unit and curation users is with individual researchers, as opposed to departments or other types of entities.
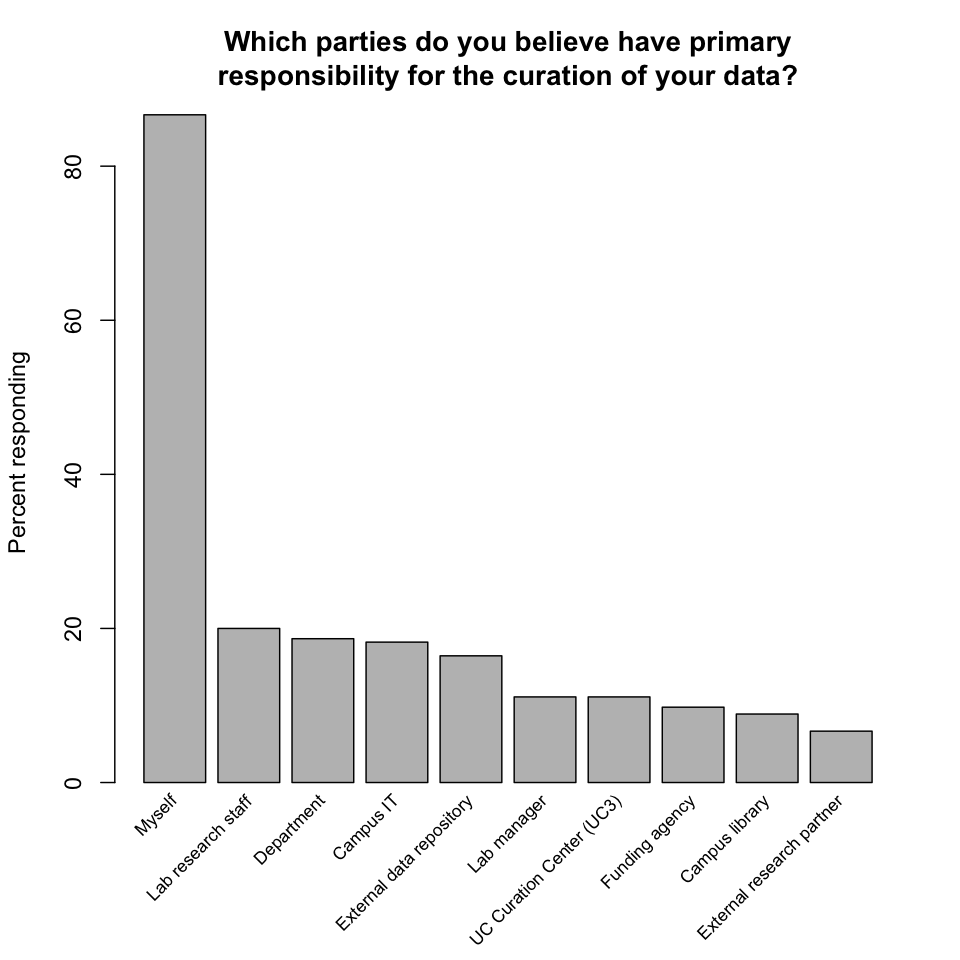
Finding: Researchers almost universally view themselves as personally responsible for the curation of their data.
-
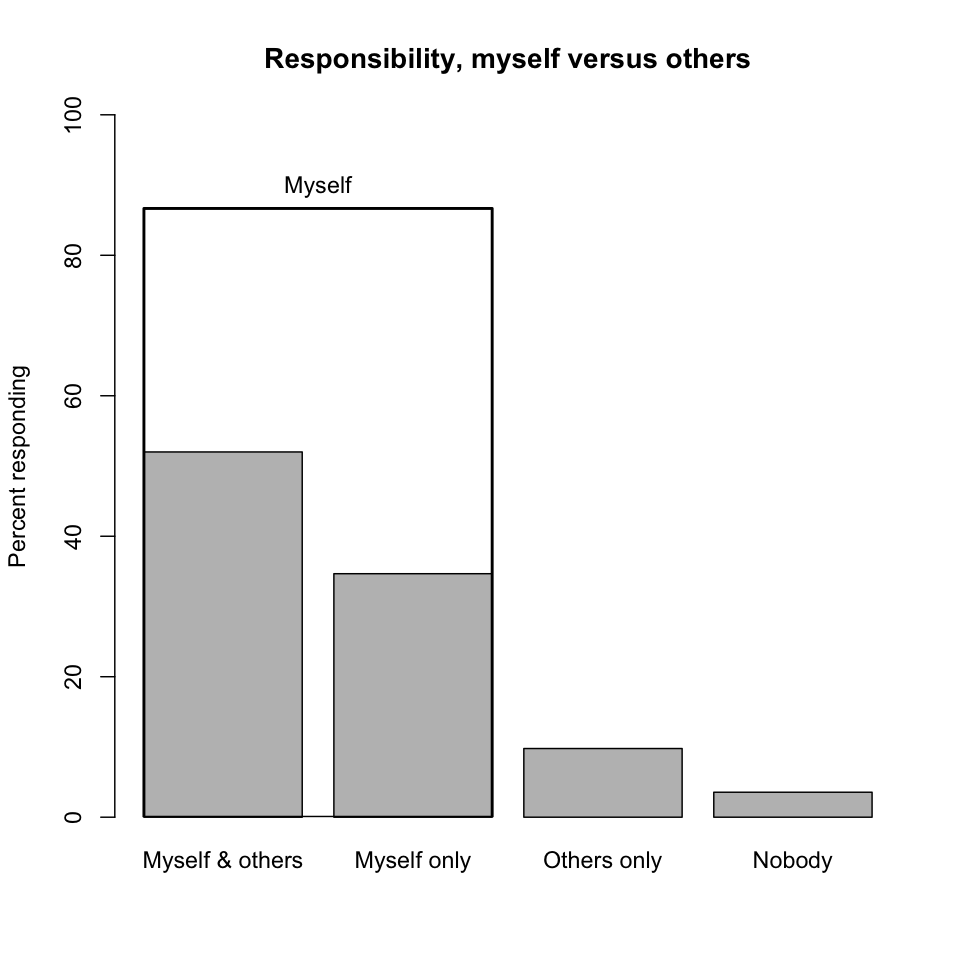
Responsibility, myself versus others. It may appear that responses to the question of responsibility are bifurcated between "Myself" and all other parties combined. However, respondents who identified themselves as being responsible were more likely than not to identify additional parties that share that responsibility. Thus, curatorial responsibility is seen as a collaborative effort. (The "Nobody" category is a slight misnomer here as it also includes non-responses to this question.)
-
Reponsibility, myself versus others (cont'd). To further understand the split between personal and other curatorial responsibility, responses have been divided here into two groups: those that include "Myself" and those that don't. Within each group the relative distributions of answers are similar, though the group excluding "Myself" indicates a greater reliance on external data repositories (the UC Curation Center is effectively an external data repository).
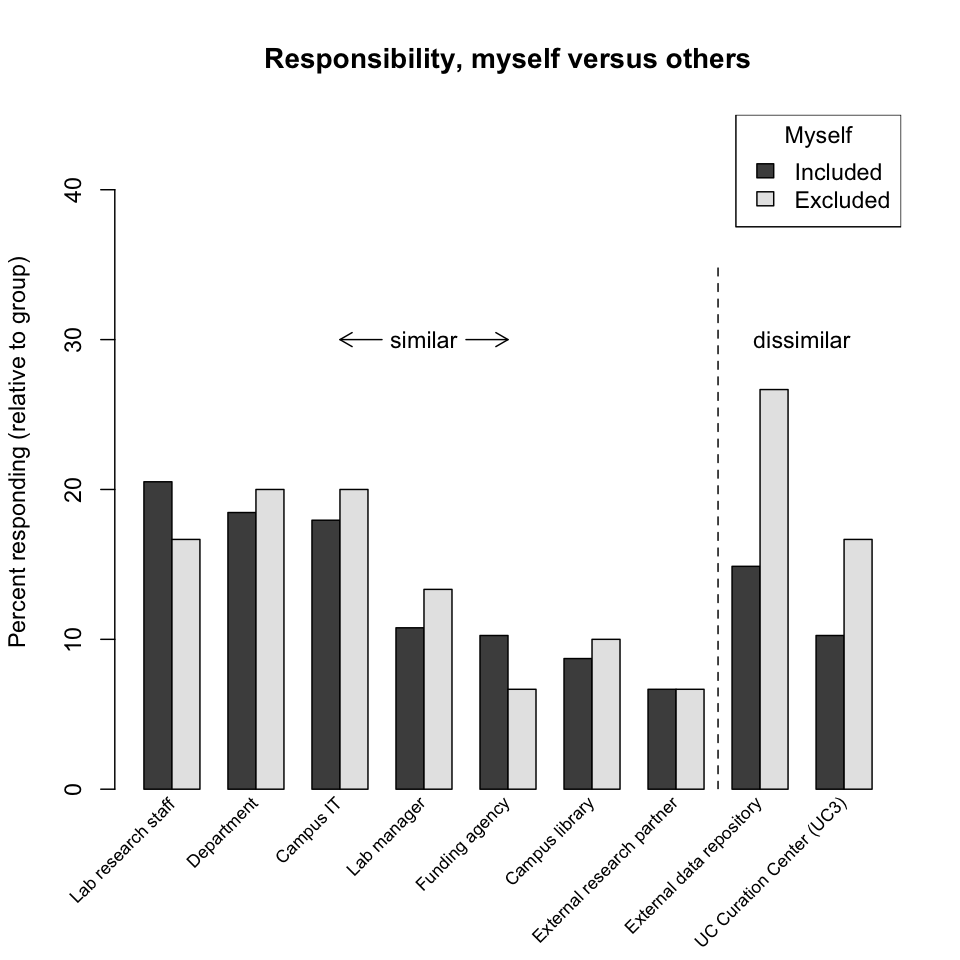
Finding: Researchers view curation as a collaborative activity and collective responsibility.
-
Respondent comments. Other parties respondents identified as having curatorial responsibilities included journals, professional societies, and research programs.
-
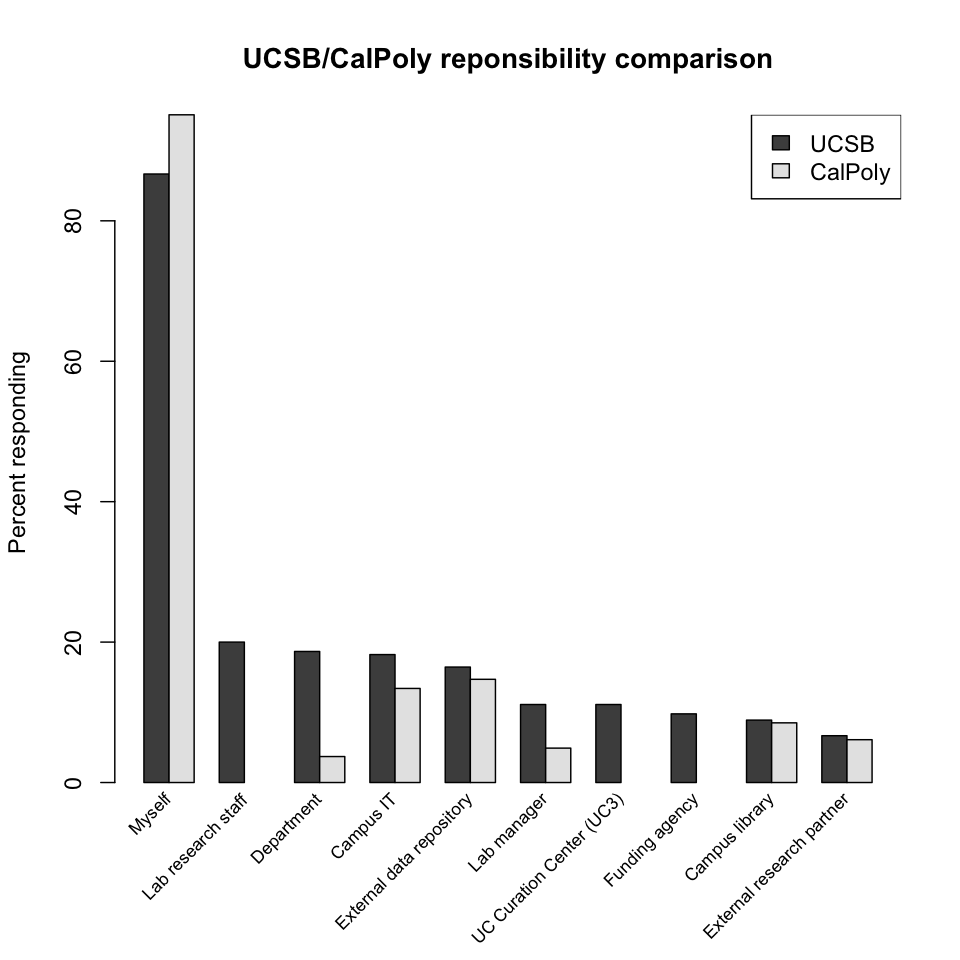
UCSB/CalPoly responsibility comparison. Librarians at the California Polytechnic State University, San Luis Obispo (CalPoly) asked a similar question of their faculty. While there are some differences in the response distributions, certainly due in part to differences in the institutions themselves, the dominant characteristic—reliance on personal curatorial responsibility—is shared. (The CalPoly data is from Figure 3 in [7]).
-
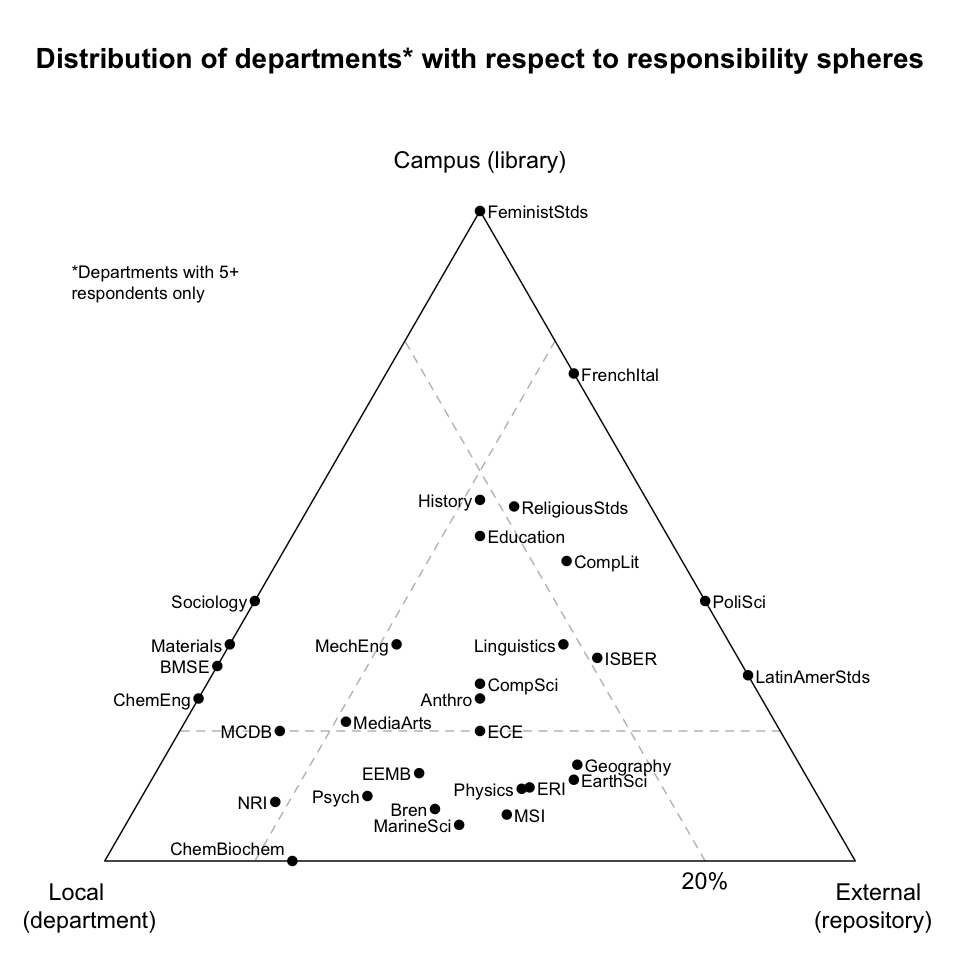
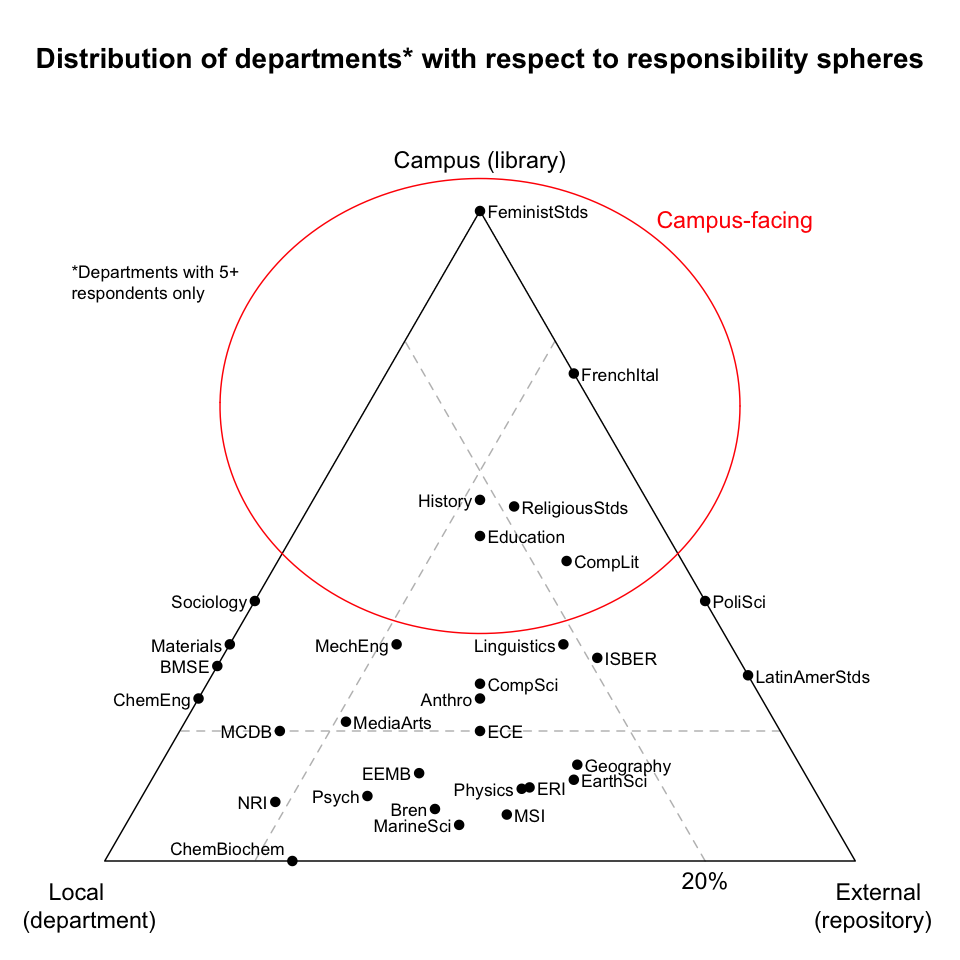
Distribution of departments with respect to responsibility spheres. Ignoring the "Myself" choice, consider clustering the parties potentially responsible for curation mentioned in the survey into three "responsibility spheres":
- "local" (comprising lab manager, lab research staff, and department);
- "campus" (comprising campus library and campus IT); and
- "external" (comprising external data repository, external research partner, funding agency, and the UC Curation Center).
Departments can then be positioned on a tri-plot of these responsibility spheres, according to the average of their respondents' answers. For example, all responses from FeministStds (Feminist Studies) were in the campus sphere, and thus it is positioned directly at that vertex. If a vertex represents a 100% share of responsibility, then the dashed line opposite a vertex represents a reduction of that share to 20%. For example, only 20% of ECE's (Electrical and Computer Engineering's) responses were in the campus sphere, while the remaining 80% of responses were evenly split between the local and external spheres, and thus it is positioned at the 20% line opposite the campus sphere and midway between the local and external spheres. Such a plot reveals that departments exhibit different characteristics with respect to curatorial responsibility, and look to different types of curation solutions.
-
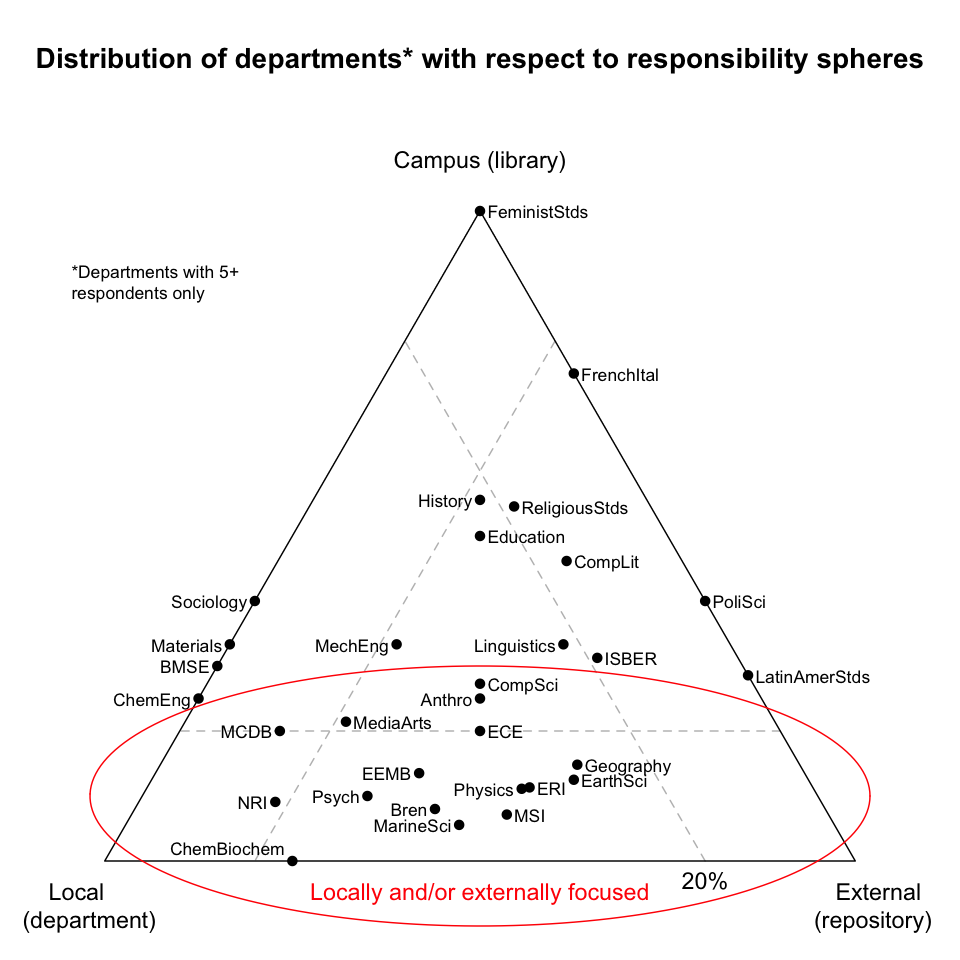
Locally and/or externally focused departments. These departments look almost exclusively to external repositories or locally-provided solutions. To the extent these solutions suffice, the departments may need little help from campus.
-
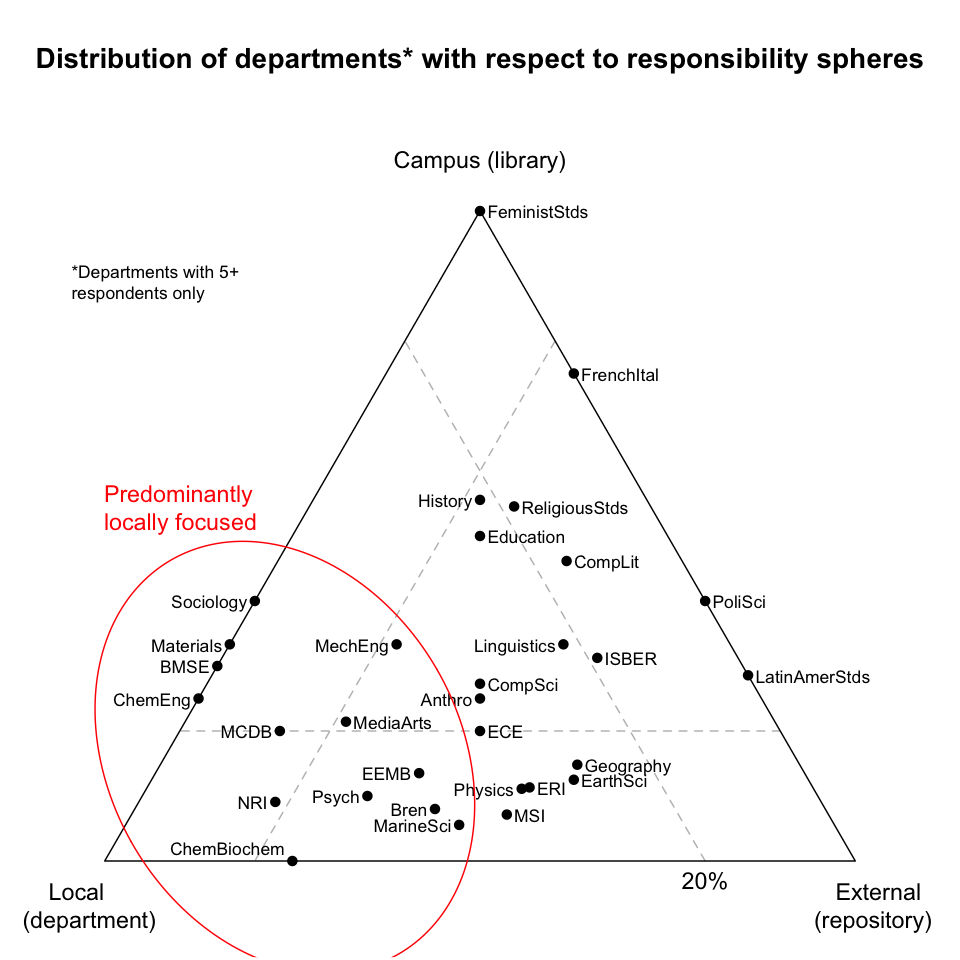
Predominantly locally focused departments. These departments look exclusively within themselves for curation. But redundancy and fallback are key requirements of any preservation solution, and with no external or other support, locally focused departments may be at risk. Such departments may benefit from establishing backup and/or contingency relationships with a campus curation unit.
-
Campus-facing departments. Lacking local or external solutions, these departments may be most in need of campus-provided solutions.
Finding: Departments have different curation requirements, and therefore may require different amounts and types of campus support.
Help needed
-
What data management activities could you use help with? Respondents requested help with every activity the survey mentioned, and suggested several others in the comments. Help with backup or archival storage dominated the responses, but even help with capturing computational provenance, a relatively specialized task with narrow applicability, garnered a vote from almost 20% of respondents.
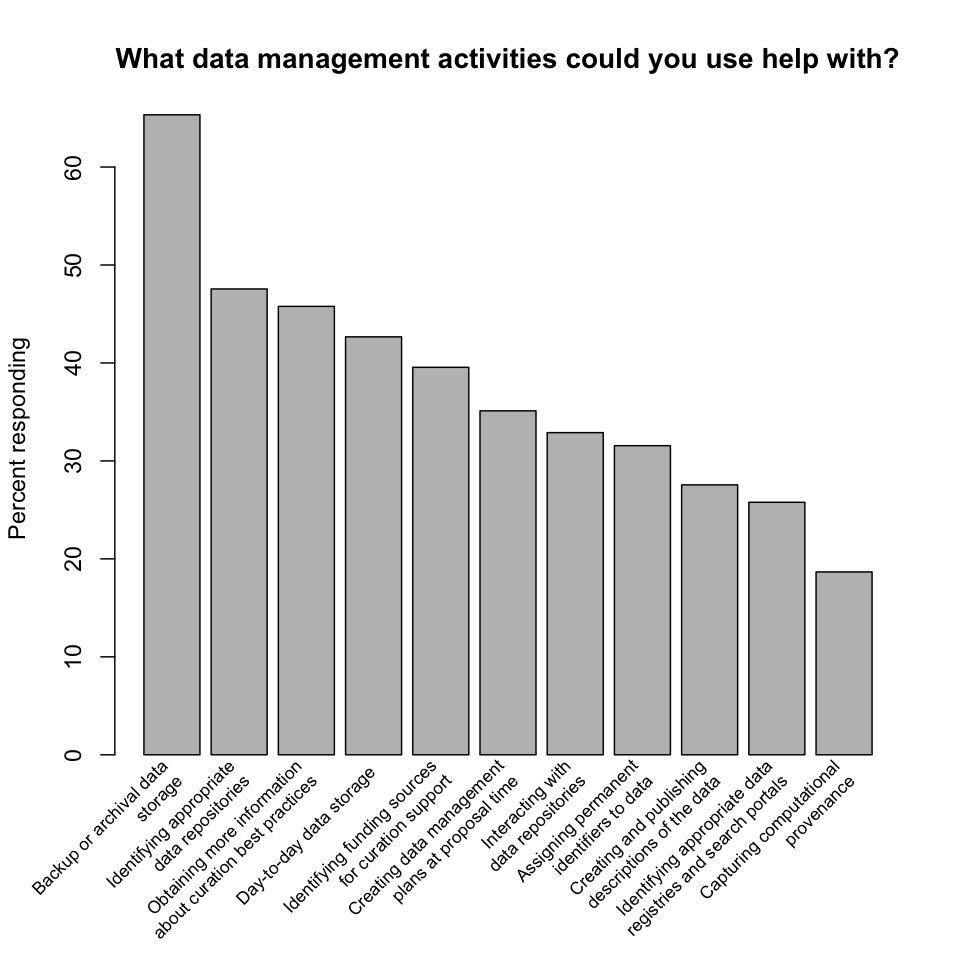
Finding: Researchers desire help with all data management activities related to curation, predominantly storage.
-
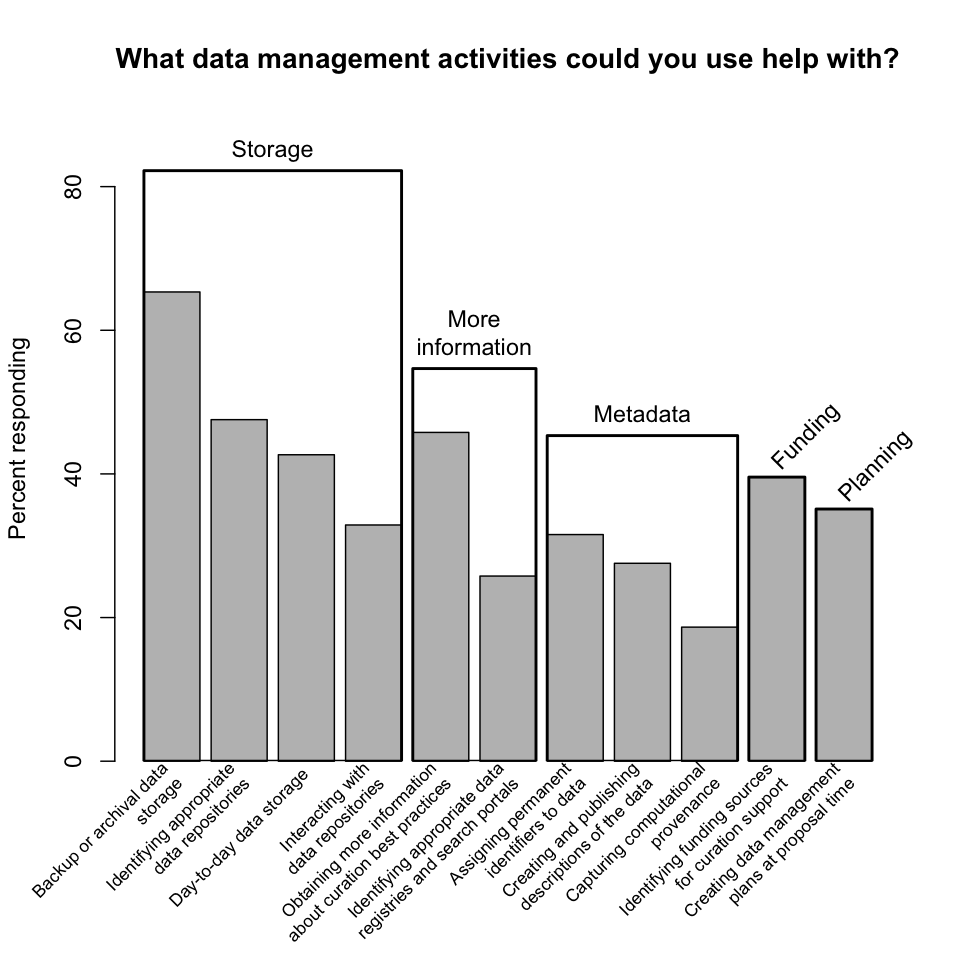
Data management activities, grouped. The data management activities mentioned by the survey can be grouped into five broader categories:
- "storage" (comprising backup or archival data storage, identifying appropriate data repositories, day-to-day data storage, and interacting with data repositories);
- "more information" (comprising obtaining more information about curation best practices and identifying appropriate data registries and search portals);
- "metadata" (comprising assigning permanent identifiers to data, creating and publishing descriptions of data, and capturing computational provenance);
- "funding" (identifying funding sources for curation support); and
- "planning" (creating data management plans at proposal time).
When the survey results are thus categorized, the dominance of storage is clear, with over 80% of respondents requesting some type of storage-related help. (This number may also reflect a general equating of curation with storage on the part of respondents.) Slightly fewer than 50% of respondents requested help related to metadata, a result explored in more detail below.
-
Metadata/repository help versus archival storage help. A common complaint made by researchers who use archival storage systems is that the systems are difficult to use, particularly because of the burdens they impose on metadata generation and object identification. Thus the low response rate for metadata-related help compared to storage-related help seen above is a little surprising. To explore this result further, this plot divides responses into two groups, those that include help with backup or archival data storage and those that do not. Within each group, the relative response rates for several activities supporting the use of repositories (assigning permanent identifiers to data, interacting with data repositories, and creating and publishing descriptions of the data) are compared. The response rates are slightly higher for the archival-storage-included group, as is to be expected; still, the response rates do not reach even 40%. This may represent a lack of awareness by researchers of the practical difficulties of using archival storage systems, which in turn may represent an opportunity for a campus curation unit to provide education and assistance in this area.
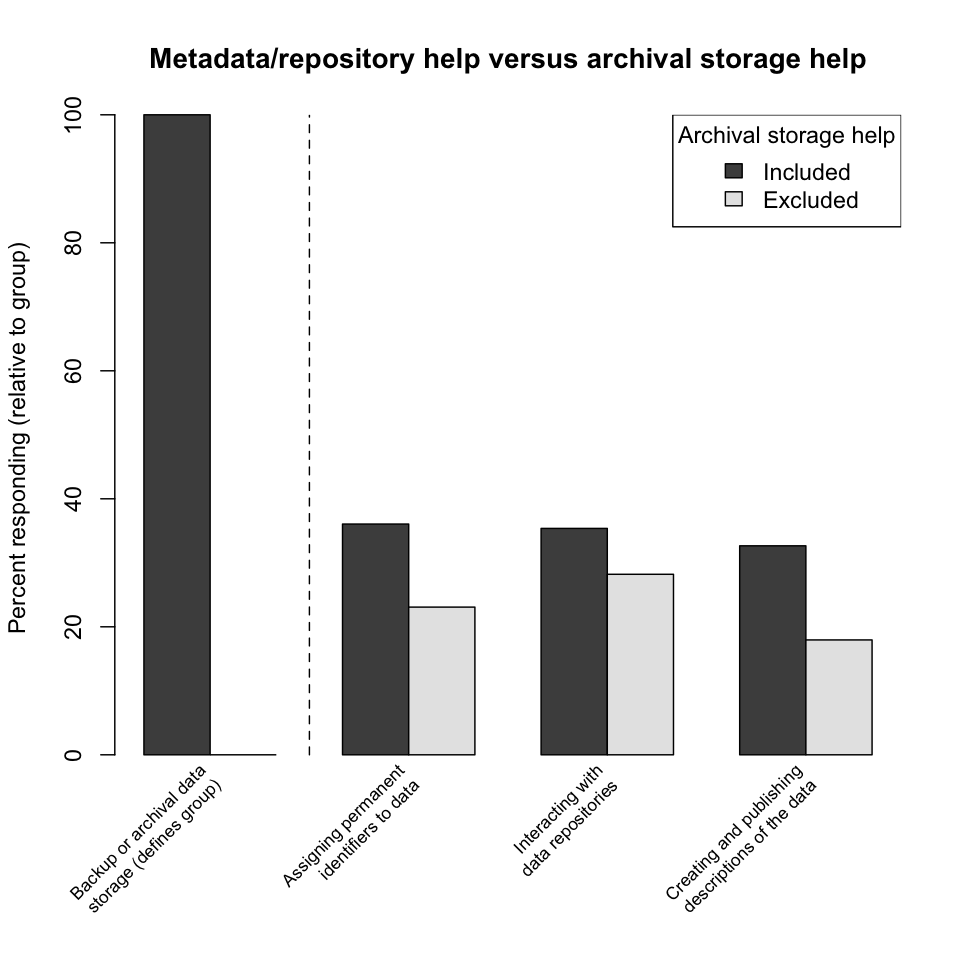
Finding: Researchers may be underestimating the need for help using archival storage systems and dealing with attendant metadata issues.
-
Respondent comments. Repondents listed several additional areas of help desired, including:
- digitization (of cassette tapes, floppies, video tapes);
- additional education (concepts, terminology);
- access (developing search systems, access systems, portals);
- format migration and software compatibility;
- connecting data and publications; and
- ethical issues.
Mandates
-
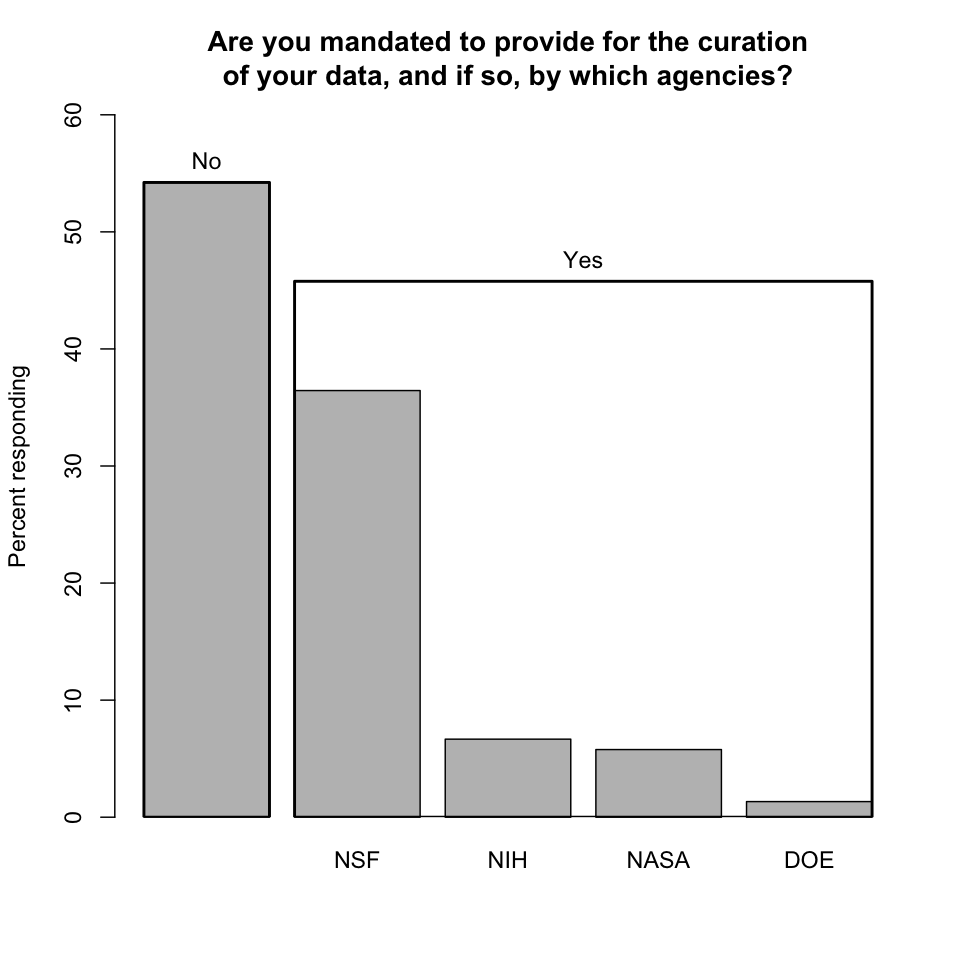
Are you mandated to provide for the curation of your data, and if so, by which agencies? Roughly half the respondents reported being so mandated, a suprisingly large percentage given the newness of mandates. NSF was the dominant mandating agency, surely a reflection of its prominence as a UCSB funding source. More interesting was the list of government funding agencies and other entities that respondents identified as additional sources of mandates.
-
Respondent comments. Respondents also identified as sources of curation mandates:
- additional U.S. federal agencies (DOD, Department of the Interior, EPA, NEH, USGS);
- grant funding organizations (NARSAD, ACLS);
- archives (Social Science Data Archive);
- corporations (pharmaceutical companies); and
- university units (Chancellor's Outreach Advisory Board).
One respondent noted that NSF doesn't have an enforcement policy. This is presumably true of other mandate sources as well, and brings up the related and perhaps more significant problem that mandates are not always (if they are ever) accompanied by the funding required to satisfy them. Another respondent wrote that funding agencies expect universities to contribute to long-term data storage.
Finding: There are many sources of curation mandates, and researchers are increasingly under mandate to curate their data.
-
Curation mandates and responsibility. Are there any correlations between mandates and responsibility for curation? In the following plot responses have been divided into two groups, those that are under mandate and those that are not. Generally, researchers under mandate identified additional responsibility parties (that is, parties other than "Myself") more frequently, while researchers not under mandate indicated a greater reliance on campus-provided solutions, campus IT support in particular. Since there is (currently, at least) such a strong correlation between being under mandate and being extramurally funded (because the source of mandates is largely external), this difference in placement of responsibility could equally be said to be correlated with funding source, external versus local.
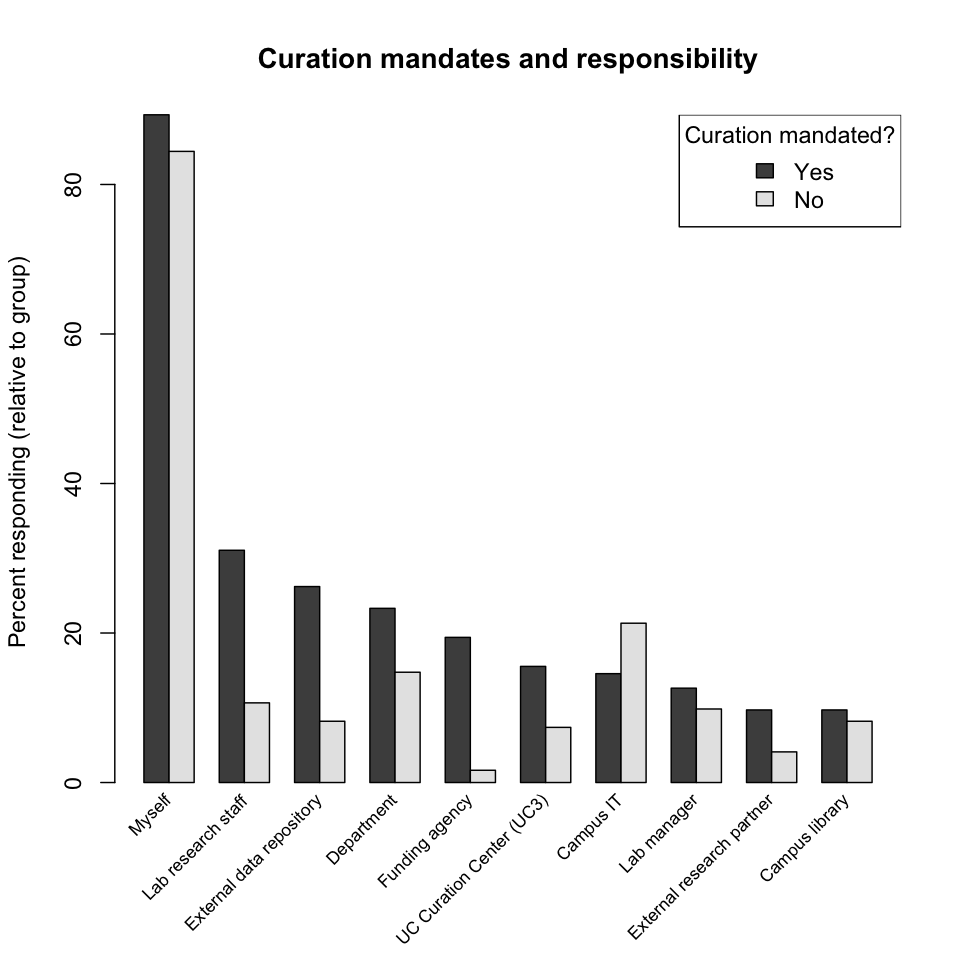
Finding: Researchers under curation mandate are more likely to collaborate with other parties in curating their data, including with their local labs and departments.
-
Curation mandates and help needed. Are there any correlations between mandates and help needed? In the following plot responses have again been divided into two groups, those that are under mandate and those that are not. Researchers under mandate are more likely to request help in all categories. The greatest disparity is in help creating data management plans; since this category of help is essentially the discriminator between the two groups, this difference is to be expected. Request rates for help with storage and learning best practices are largely similar.
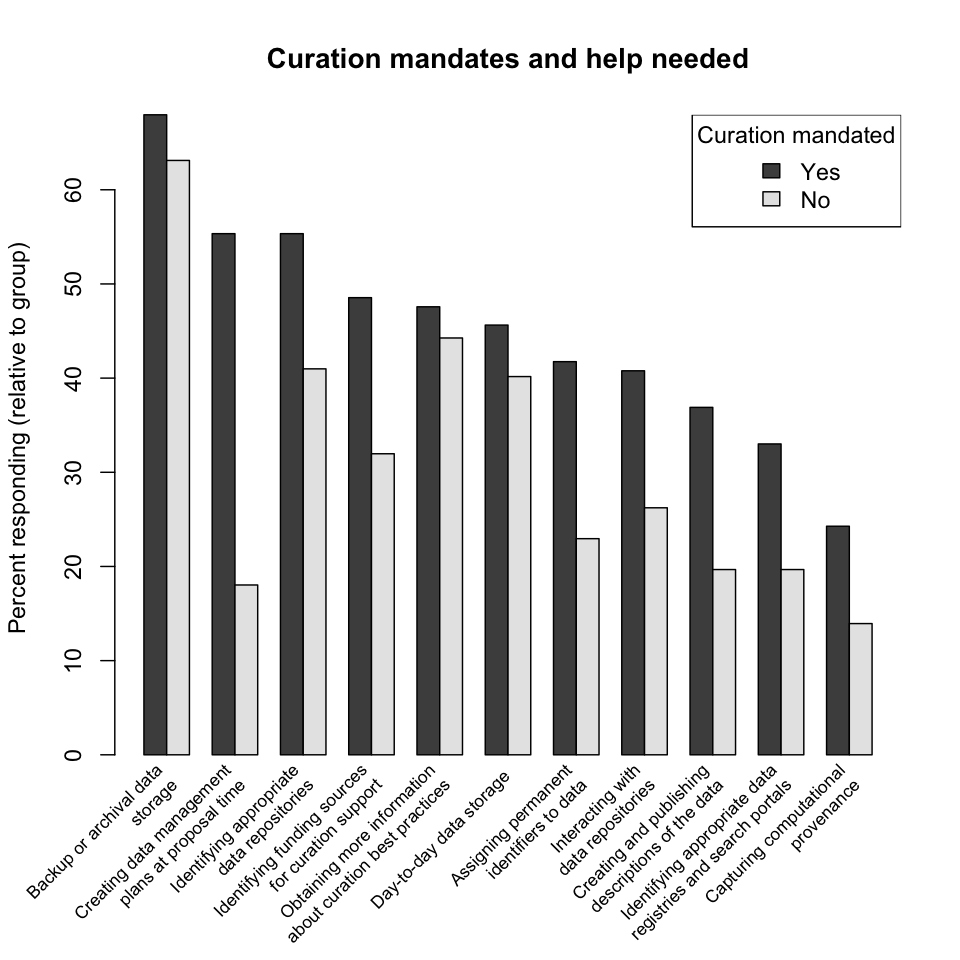
Finding: Researchers under curation mandate request more help with all curation-related activities; put another way, curation mandates are an effective means of raising curation awareness.
Demographics
-
Distribution of responses by department. "Department" here refers to departments proper, centers, institutes, organized research units (ORUs) and other types of named campus entities. Over 90% of departments are represented by at least one response in the survey. The representation by department is not uniform, but follows an exponential distribution (note that multiple affiliations are counted multiply in the plot below). The five departments most represented in the survey are, in order: ERI, MSI, EEMB, ISBER, and Bren.
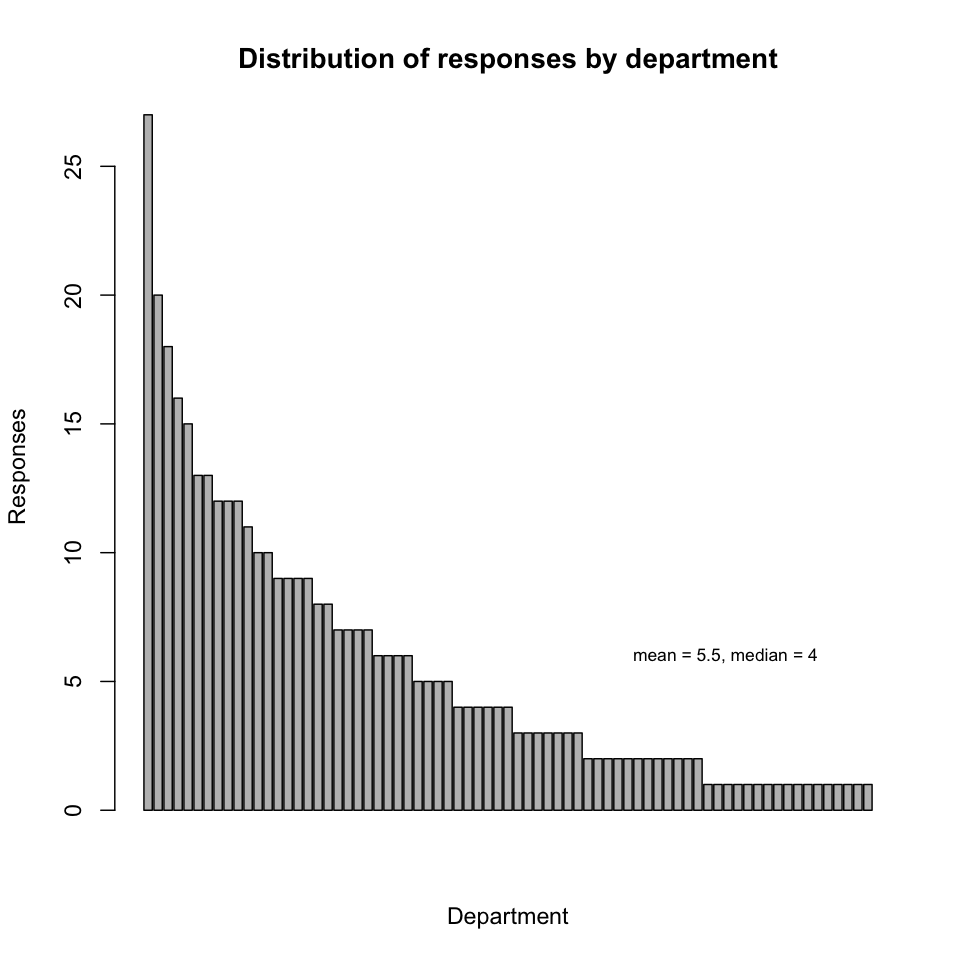
Finding: Curation of digital data is a concern for almost every department and unit on campus.
-
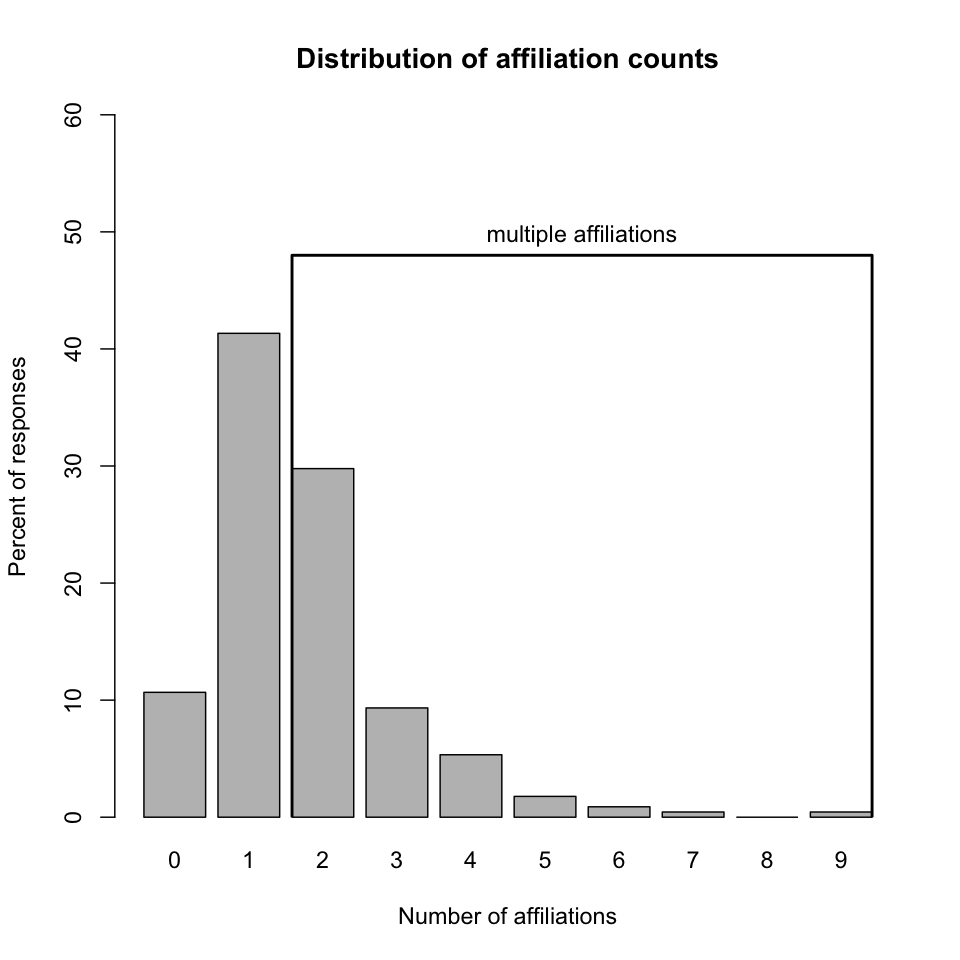
Distribution of affiliation counts. Characterizing the coverage of the survey with respect to departments is not straightforward because respondents were able to select more than one departmental affiliation, and indeed nearly half did so.
-
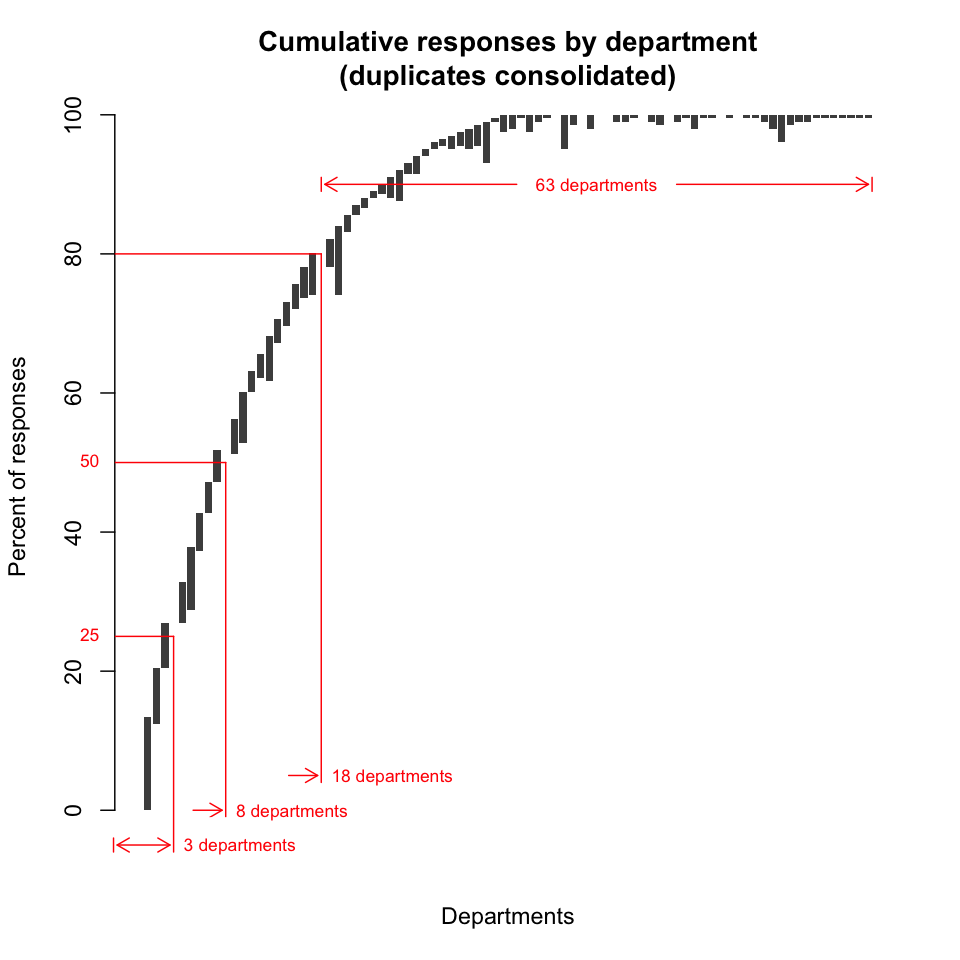
Cumulative responses by department (multiple affiliations consolidated). The following plot is essentially a bar chart in which bar length represents the percentage of individual responses contributed by a department. However, the bars have been positioned vertically to remove the effect of multiple affiliations so that, read left to right, the plot accurately reflects cumulative individual responses. Furthermore, departments have been ordered left-to-right to minimize overlap; put another way, the number of departments required to achieve a given percentage of responses has been minimized [10]. Thus we see that, to account for 25% of the individual responses, at least 3 departments must be included (ERI, ISBER, and Physics would be one possible set of departments). To account for 50% of the responses, at least 8 departments must be included (an example would be the aforementioned three, plus History, EEMB, MCDB, Chemistry, and Comparative Literature). And to account for 80% of the individual responses, at least 18 departments must be included (for example, the aforementioned eight, plus Computer Science, Bren School, Psychology, Education, Geography, Materials, Mechanical Engineering, Media Arts, Political Science, and Anthropology).
Finding: The survey reflects the concerns of a broad cross-section of campus.
Survey comments
At the end of the survey a space was provided where respondents could enter any additional comments, a sampling of which have been loosely categorized and included below.
- Kudos & interest in curation
- "I welcome this initiative and for me it is very timely."
- "Very important. One can only speculate at the lost research insights and lost innovations that have occurred."
- "I got some help on my last grant from the office of research on a data management plan. Much appreciated."
- "Thank you for this study. I, and probably other faculty and staff, would benefit from learning more about data storage/dissemination options."
- "I [...] want to know what I can do to help preserve and migrate the digital data being produce by our organization."
- Respondent identification
- "I am a data manager on campus..."
- "I am a librarian and administrator of several unit-wide databases..."
- "I am a visiting scholar at UCSB."
- Preservation strategies
- "I save all my de-identified data in Gmail. I simply send anything I want to save to myself..."
- "I use datadryad.org to publish my data with my papers and I am quite happy with their service."
- Content types
- "...digital data and physical collections..."
- "...microfilmed archival material..."
- "...video..."
- "...e-mail..."
- "...VHS collection..."
- "...some rare [...] cartoons in French..."
- "...'data bank' type data..."
- Problems
- "For the most part, [...] computers and storage are not a problem, however, software tools are in short supply. One of the largest hurdles is finding tools to efficiently gather and assemble metadata into prescribed models. Libraries have been engaged with these issues (for print resources) for many years, whereas many fields of research are just starting this process. It would benefit those fields greatly to have libraries apply their experience and resources to the curation of digital resources."
- "...almost everyone in my department needs lots of support with irreplaceable digital data that will be of great value to future generations. And we cannot take care of the task by ourselves."
- "...[need] mechanisms that might help simplify the curation of my own laboratories data for the support of our individual research publications."
- Suggestions
- "You may wish to include the campus Museum in your list of programs..."
- "...Davidson [Library] should be recognized as central to digital research on our campus and its budget should be increased to foster faculty research..."
Appendix: survey meta-analysis
-
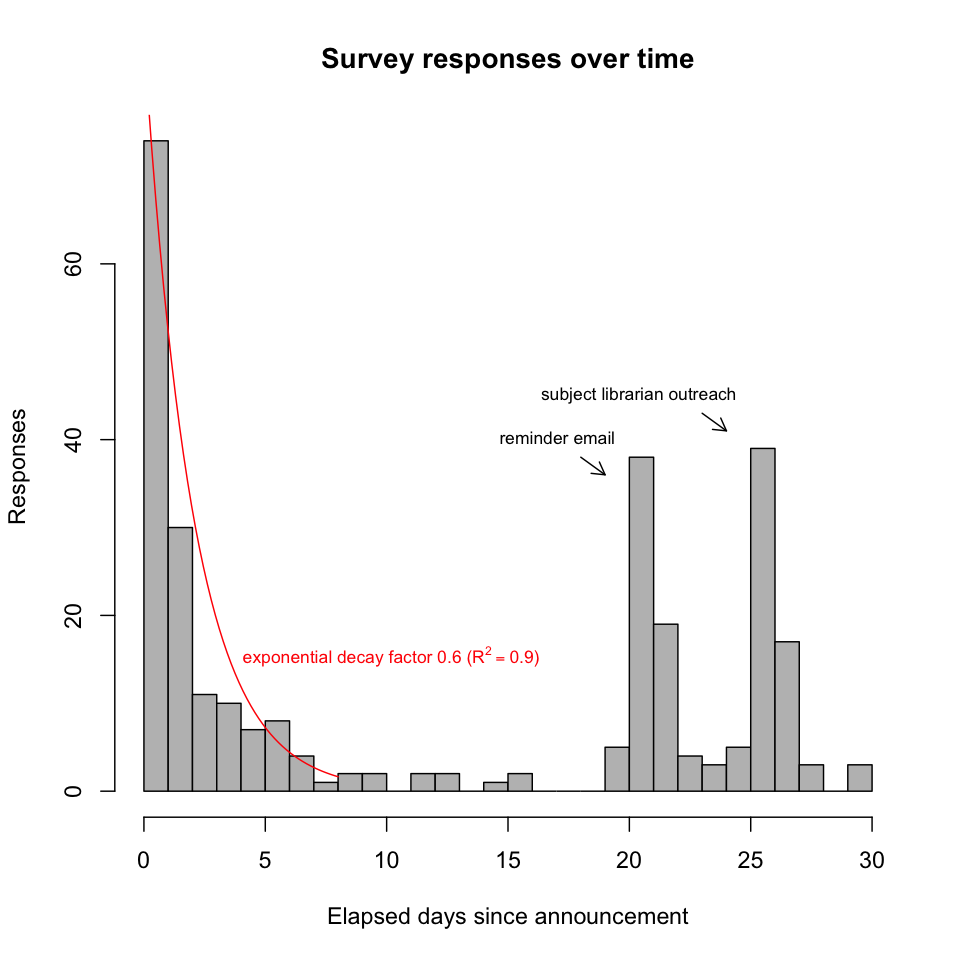
Survey responses over time. Survey responses fell into three phases, with the responses in each phase dropping off exponentially over time as predicted by survey literature [6]. The second phase was triggered by a reminder email; the third, by subject librarians reaching out to their respective departments.
-
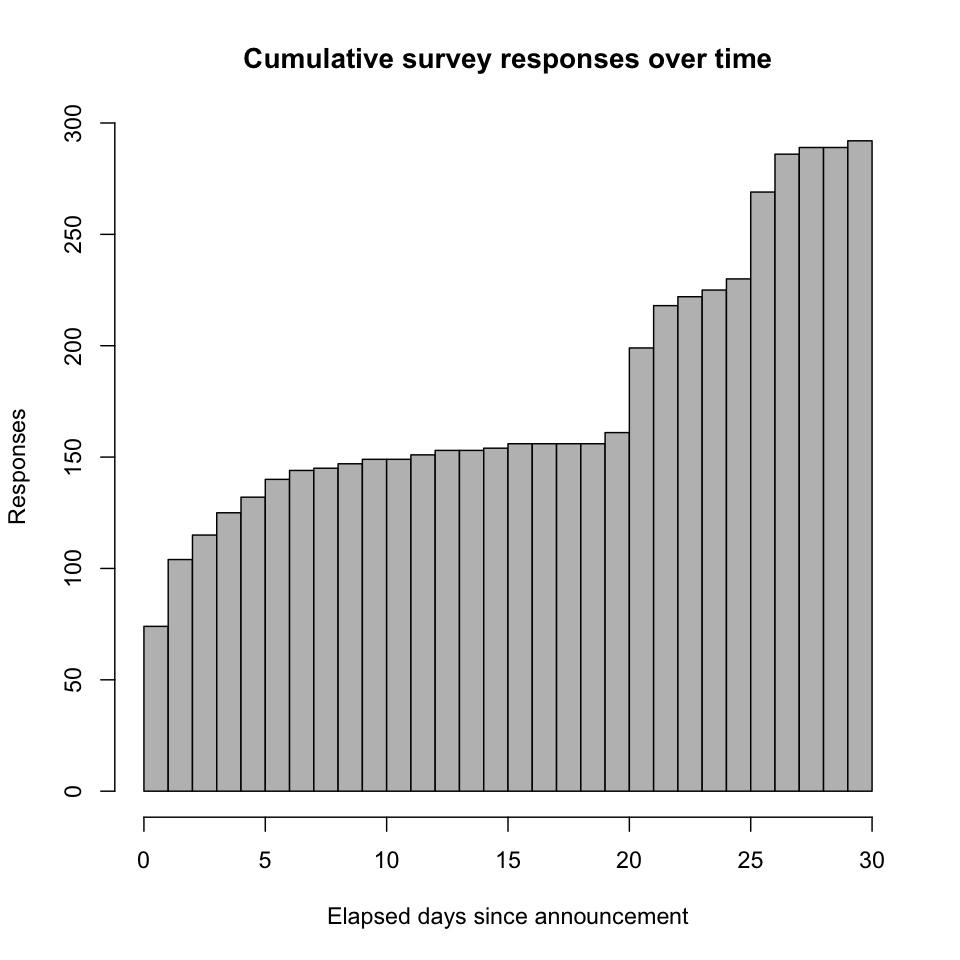
Cumulative survey responses over time. The second and third phases doubled the number of responses.
-
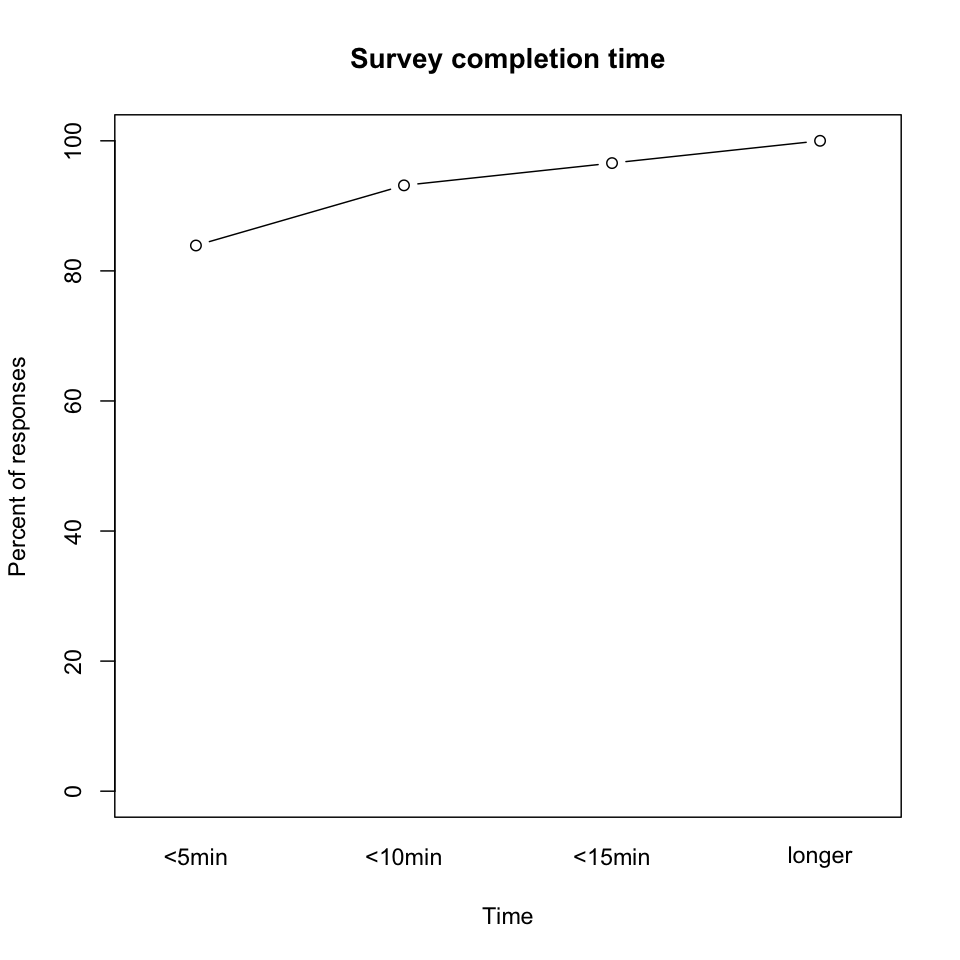
Survey completion time. The survey claimed it could be completed in 5 minutes, and that was largely true. (Durations are derived from first and last browser-website interactions.)
-
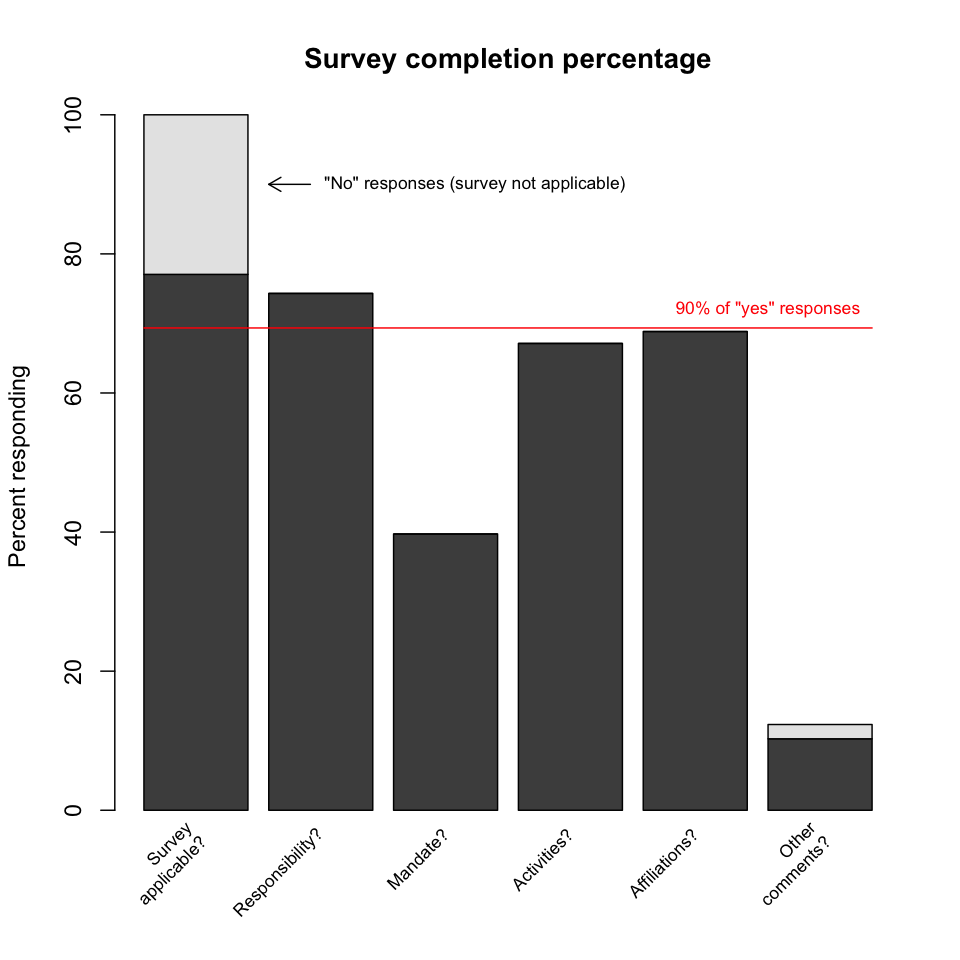
Survey completion percentage. The logic of the survey dictated that a "no" response to the first question (which essentially asked, "Is this survey applicable to you?") directed the respondent directly to the end of the survey, where a comment could optionally be provided; a few respondents did so. For those who responded "yes" to the first question, the final question asked for the respondent's affiliations. Since all respondents should be able to answer this, the final question thus serves as a progress indicator. 90% of "yes" respondents answered the final question, and thus falloff was not a significant issue for this survey.
References
- J. Scott Armstrong and Terry S. Overton (1977). Estimating Nonresponse Bias in Mail Surveys. Journal of Marketing Research 14: 396-402.
- Claudia Engelhardt, Stefan Strathmann, and Katie McCadden (2012). Report and analysis of the survey of Training Needs. Digital Curator Vocational Education Europe (DigCurV) project, April 2012.
- Robert M. Groves (2006). Nonresponse Rates and Nonresponse Bias in Household Surveys. Public Opinion Quarterly 70(5): 646-675. doi:10.1093/poq/nfl033
- Kathryn Lage, Barbara Losoff, and Jack Maness (2011). Receptivity to Library Involvement in Scientific Data Curation: A Case Study at the University of Colorado Boulder. portal: Libraries and the Academy 11(4): 915-937. doi:10.1353/pla.2011.0049
- Kristen Olson (2006). Survey Participation, Nonresponse Bias, Measurement Error Bias, and Total Bias. Public Opinion Quarterly 70(5): 737-758. doi:10.1093/poq/nfl038
- Bing Pan (2010). Online Travel Surveys and Response Patterns. Journal of Travel Research 49(1): 121-135. doi:10.1177/0047287509336467
- Jeanine Marie Scaramozzino, Marisa L. Ramírez, and Karen J. McGaughey (2012). A Study of Faculty Data Curation Behaviors and Attitudes at a Teaching-Centered University. College & Research Libraries 73(4): 349-365.
- Susan Wells Parham, Jon Bodnar, and Sara Fuchs (2012). Supporting tomorrow's research: Assessing faculty data curation needs at Georgia Tech. College & Research Libraries News 73(1) (January 2012): 10-13.
- James Wilson (2013). University of Oxford Research Data Management Survey 2012: The Results. Data Management Rollout in Oxford (DaMaRO) blog, 2013-01-03.
Notes
- Determining the minimum number of departments required to account for a given percentage of individual responses is a kind of "set cover" problem that is difficult to solve. The plot depicts a particular "greedy" strategy for covering responses that yields a solution that may be only approximately optimal. However, the correctness of two of the plot's three main assertions (that 3 and 8 departments are required to cover 25% and 50% of responses, respectively) was verified by exhaustive search.
created 2013-10-15; last modified 2013-10-16 18:51